
Categories
Local Market UpdatesPublished October 18, 2026
October 2026 Northwest Indiana Housing Market Update: Lake & Porter County

October 2026 Northwest Indiana Housing Market Update: Lake & Porter Counties
“So, how’s the market?”
We get this question a lot, and the answer usually starts with another question:
"Where are you looking, and what are you hoping to do?"
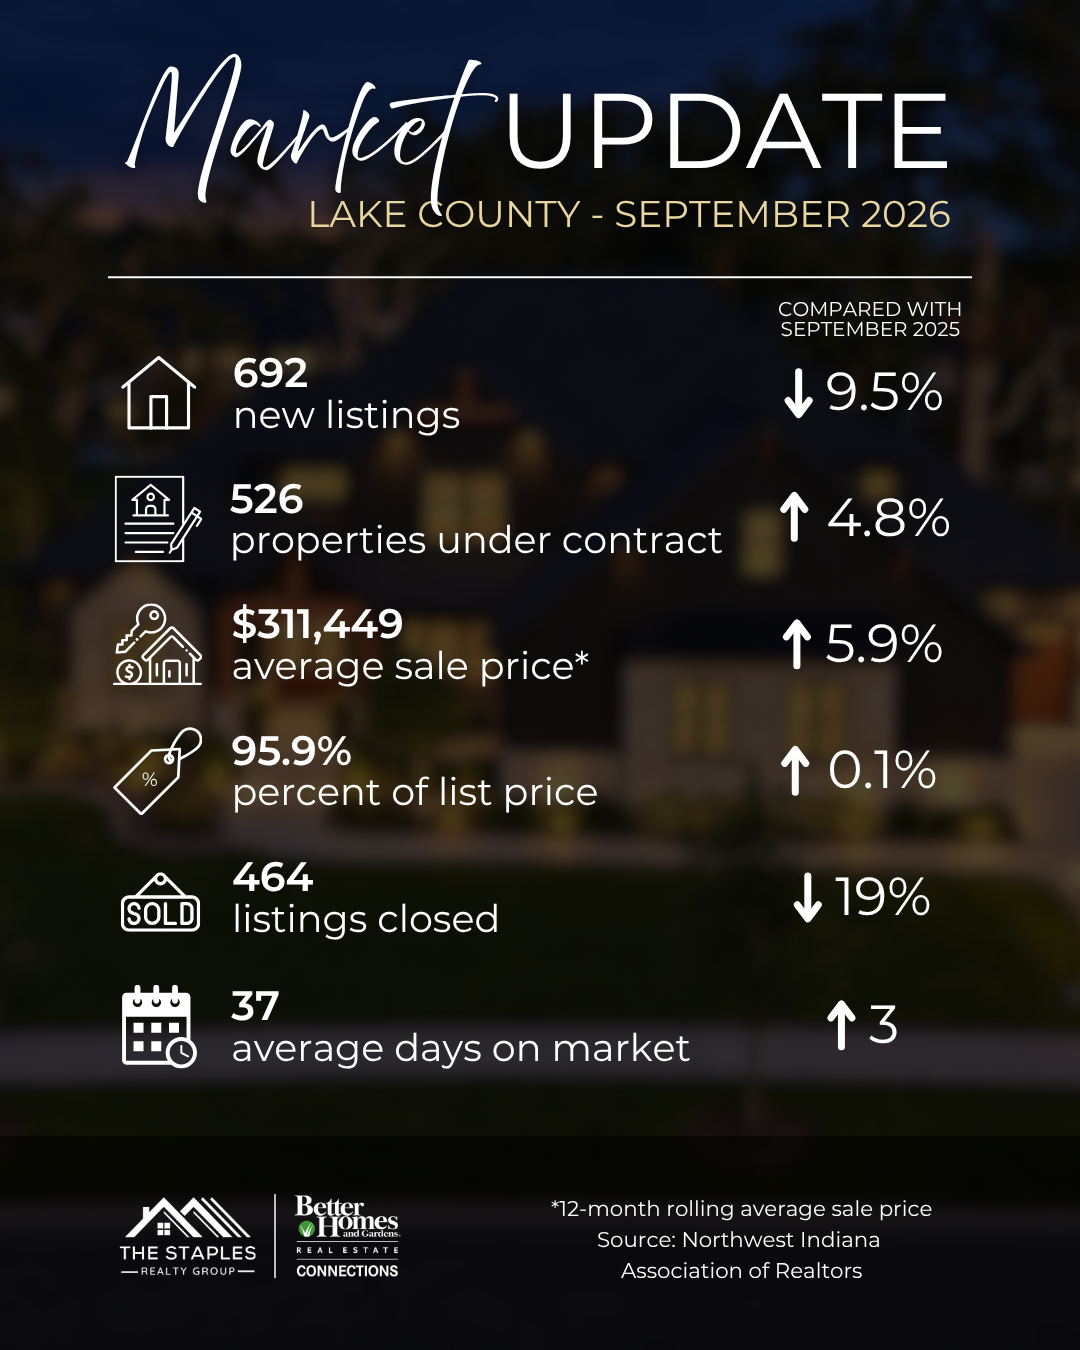
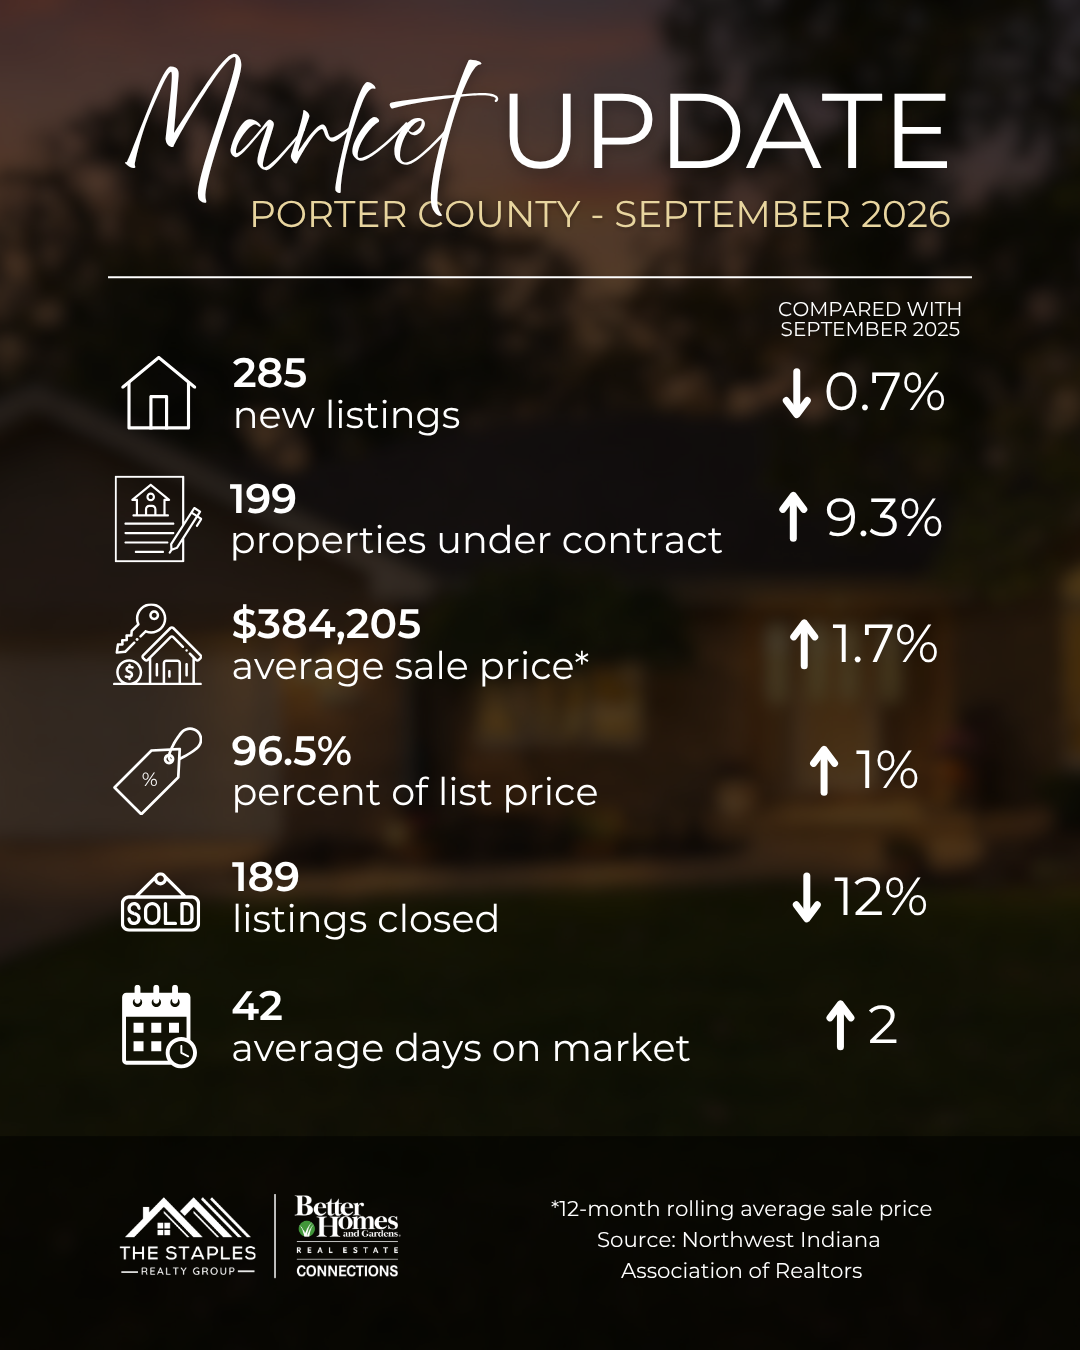
For our October update, we’re looking at September 2026 housing data for Lake and Porter counties in Indiana, compared with September 2025. More homes went under contract in both counties, fewer sales closed, and homes took a little longer to sell on average. The 12-month rolling average sale price also increased in both counties.
Here’s a closer look at the numbers, and what they could mean if you’re thinking about buying or selling:
September 2026 Housing Market Statistics
| Market measure | Lake County | Change from September 2025 | Porter County | Change from September 2025 |
|---|---|---|---|---|
| New listings | 692 | Down 9.5% | 285 | Down 0.7% |
| Properties under contract | 526 | Up 4.8% | 199 | Up 9.3% |
| Average sale price* | $311,449 | Up 5.9% | $384,205 | Up 1.7% |
| Percent of list price received | 95.9% | Up 0.1 percentage points | 96.5% | Up 1.0 percentage point |
| Closed sales | 464 | Down approximately 19% | 189 | Down approximately 12% |
| Average days on market | 37 days | Up 3 days | 42 days | Up 2 days |
Average sale prices represent a 12-month rolling average, rather than sales from September alone. It captures the better overall trend of home values.
Source: NIRA MLS, data retrieved October 18, 2026.
More homes went under contract, but fewer sales closed. Why?
At first glance, those numbers might seem to tell contradicting stories. However, they measure different stages of the process.
A home going under contract means a buyer and seller have reached an agreement. A closed sale, however, means the transaction has been completed, keys and funds have been exchanged and there's no longer a sale sign in the yard. Because of the length of time it takes to work through a transaction, those milestones usually happen in different months.
Additionally, the August 11th derecho also belongs in the conversation. The storm caused extensive, widespread damage across Northwest Indiana, with many areas experiencing extended power outages. This may have caused a reduction in the number of purchase agreements written in August, resulting in fewer homes closing in September.
While the raw data doesn’t tell us how many sales were affected by the storm, this is our conclusion based on our activity and experience with our clients during August and September.
What these numbers mean for buyers.
Homes that sold spent an average of 37 days on the market in Lake County and 42 days in Porter County. That’s slightly longer than last September, which may give buyers a little more breathing room with some properties.
The important part is “some properties.”
A county-wide average doesn’t tell you how much competition you’ll face for a specific home. Location, condition, price, and how well a home fits what buyers are looking for all affect the experience.
Similarly, the average percent of list price received isn’t a discount you can automatically apply to every listing. It’s a broad market measure. When deciding what to offer, we’d look closer at comparable sales, the home’s condition, its pricing history, and the competition around it.
There may be opportunities to negotiate. The best approach depends on the home and your circumstances.
What these numbers mean for sellers.
More homes went under contract in both counties than last September. Buyers are still making moves, but that doesn’t mean every home will sell quickly or at any asking price. Thoughtful pricing and preparation for listing remain important.
Before listing, it helps to understand what buyers could choose instead of your home. How does your property compare with similar homes currently available? What have comparable properties actually sold for? Are there repairs or presentation issues worth addressing before photography and showings?
Those details are more useful for setting your strategy than a county-wide headline alone.
And while the rolling average sale price increased in both counties, that doesn’t mean every individual home increased in value by the same percentage. Changes in the mix of homes sold can affect an average, too.
What does this mean for your neighborhood?
Lake and Porter counties cover many different neighborhoods, property types, and price ranges. Your experience in Crown Point may look different from someone buying or selling in Cedar Lake, St. John, or Valparaiso.
These monthly numbers give us a useful starting point. From there, we can narrow the picture to the homes and neighborhoods that matter to you. So if you’re wondering how your area compares, or simply want help making sense of what you’re seeing, we’re happy to take a closer look with you.
Marc Staples & Eric Siedschlag
The Staples Realty Group
Better Homes & Gardens Real Estate Connections
📞 (219) 433-5002 • (219) 218-4863
📧 Marc@StaplesREGroup.com • Eric@StaplesREGroup.com
Market data: NIRA MLS via MarketStats, retrieved October 18, 2026. September 2026 compared with September 2025; average sale prices use a 12-month rolling average. Storm background: National Weather Service summary of the August 11, 2026 derecho.
or another way